Monitor GitHub Copilot Credit Usage with the GitHub API and Grafana Dashboard
GitHub Copilot Credit usage is not always suitable for everyone to view directly in GitHub. This article shows how to fetch the data through the GitHub API and send it to a Grafana Dashboard.

Since the GitHub Copilot update on June 1, usage-based billing has made it more important to monitor each user’s Credit usage.
Although GitHub already provides Budgets and alerts, which lets administrators send alerts when users are close to or have already reached their usage limits, it is still not ideal to grant extra GitHub permissions or seats just so executives or other non-developers can view usage data.
So I wanted to pull GitHub Copilot usage data out of GitHub and display it in an existing Grafana Dashboard. This keeps GitHub focused on development and source code management, while usage monitoring and alerting stay inside Grafana, keeping the monitoring workflow consistent.
This article records the full flow: creating a GitHub Token, preparing a Grafana Dashboard, using a cronjob to fetch Copilot metrics, and finally updating the Infinity panel data in Grafana through the Grafana API.
Prerequisites
Before starting, prepare the following permissions and tools:
- GitHub Organization permissions, used to create a Token that can read Copilot metrics.
- Grafana administrator permissions, used to install the Infinity datasource plugin, create a Service Account Token, and create a Dashboard.
- An environment that can run a script on a schedule, such as a Kubernetes CronJob, Linux cron, GitLab CI schedule, or another scheduler.
curlandjq, used to call APIs and process JSON.
The example in this article uses bash with curl and jq, so there is no need to build a separate application.
GitHub
First, create a GitHub Token that can read Organization Copilot metrics.
In GitHub, go to:
Profile picture in the upper-right corner -> Settings -> Credentials -> Fine-grained personal access tokens
Use the newer Fine-grained personal access tokens here. Do not select the older Personal access tokens (classic).
When creating the Token, pay special attention to the Owner field. Select the Organization instead of your personal account.
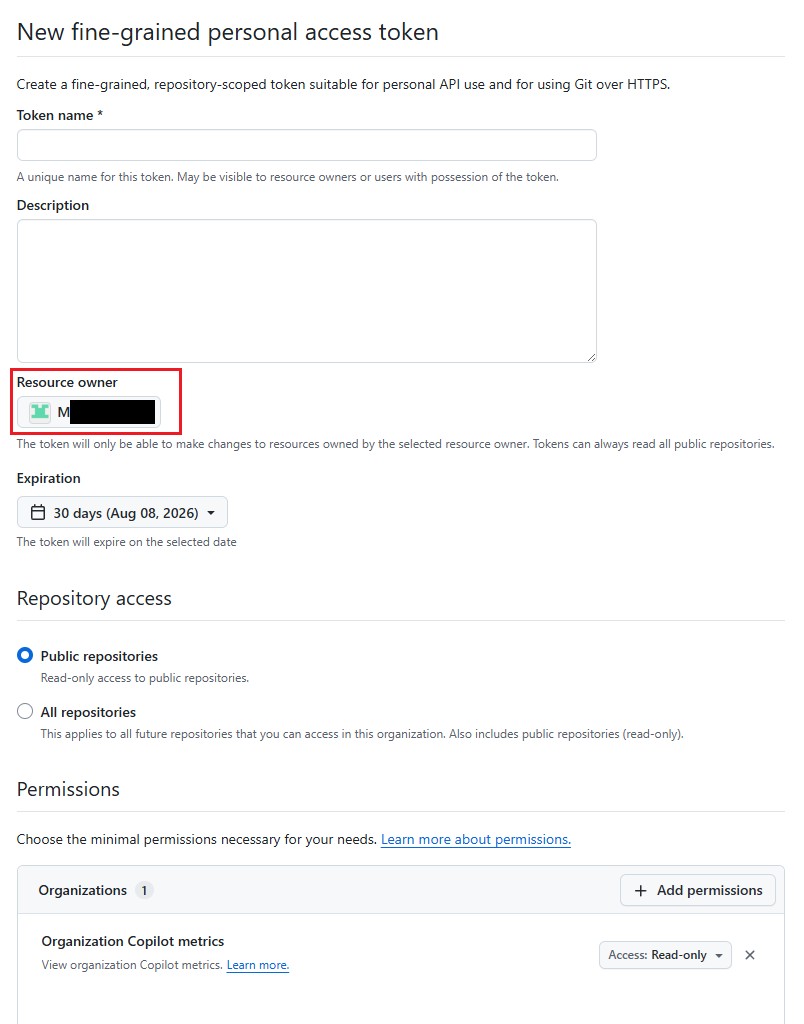
If the Owner is correctly set to the Organization, you will be able to find Organization Copilot metrics under Add permissions. After creating the Token, you will receive a token in a format similar to the following:
1
ghp_xxxxxxxxxxxxxxxxxxxxxxxxxxxxxxxxxxxx
Store it securely. GitHub only shows the Token once when it is created.
After getting the Token, you can use the following API to verify that the permissions work. Replace YOUR_TOKEN and {Organization} with your own values.
1
2
3
4
5
curl -L \
  -H "Accept: application/vnd.github+json" \
  -H "Authorization: Bearer YOUR_TOKEN" \
  -H "X-GitHub-Api-Version: 2022-11-28" \
  https://api.github.com/orgs/{Organization}/copilot/metrics/reports/users-28-day/latest
If the request returns successfully, the Token permissions are roughly correct, and you can use this Token later in the scheduled environment.
Grafana
On the Grafana side, we need to do three things:
- Install the Infinity datasource plugin.
- Create a Service Account Token so the cronjob can update the Dashboard through the Grafana API.
- Create a Dashboard and Panel, then let the cronjob write the processed JSON into that panel.
Install the Infinity Plugin
The plugin to install is yesoreyeram-infinity-datasource.
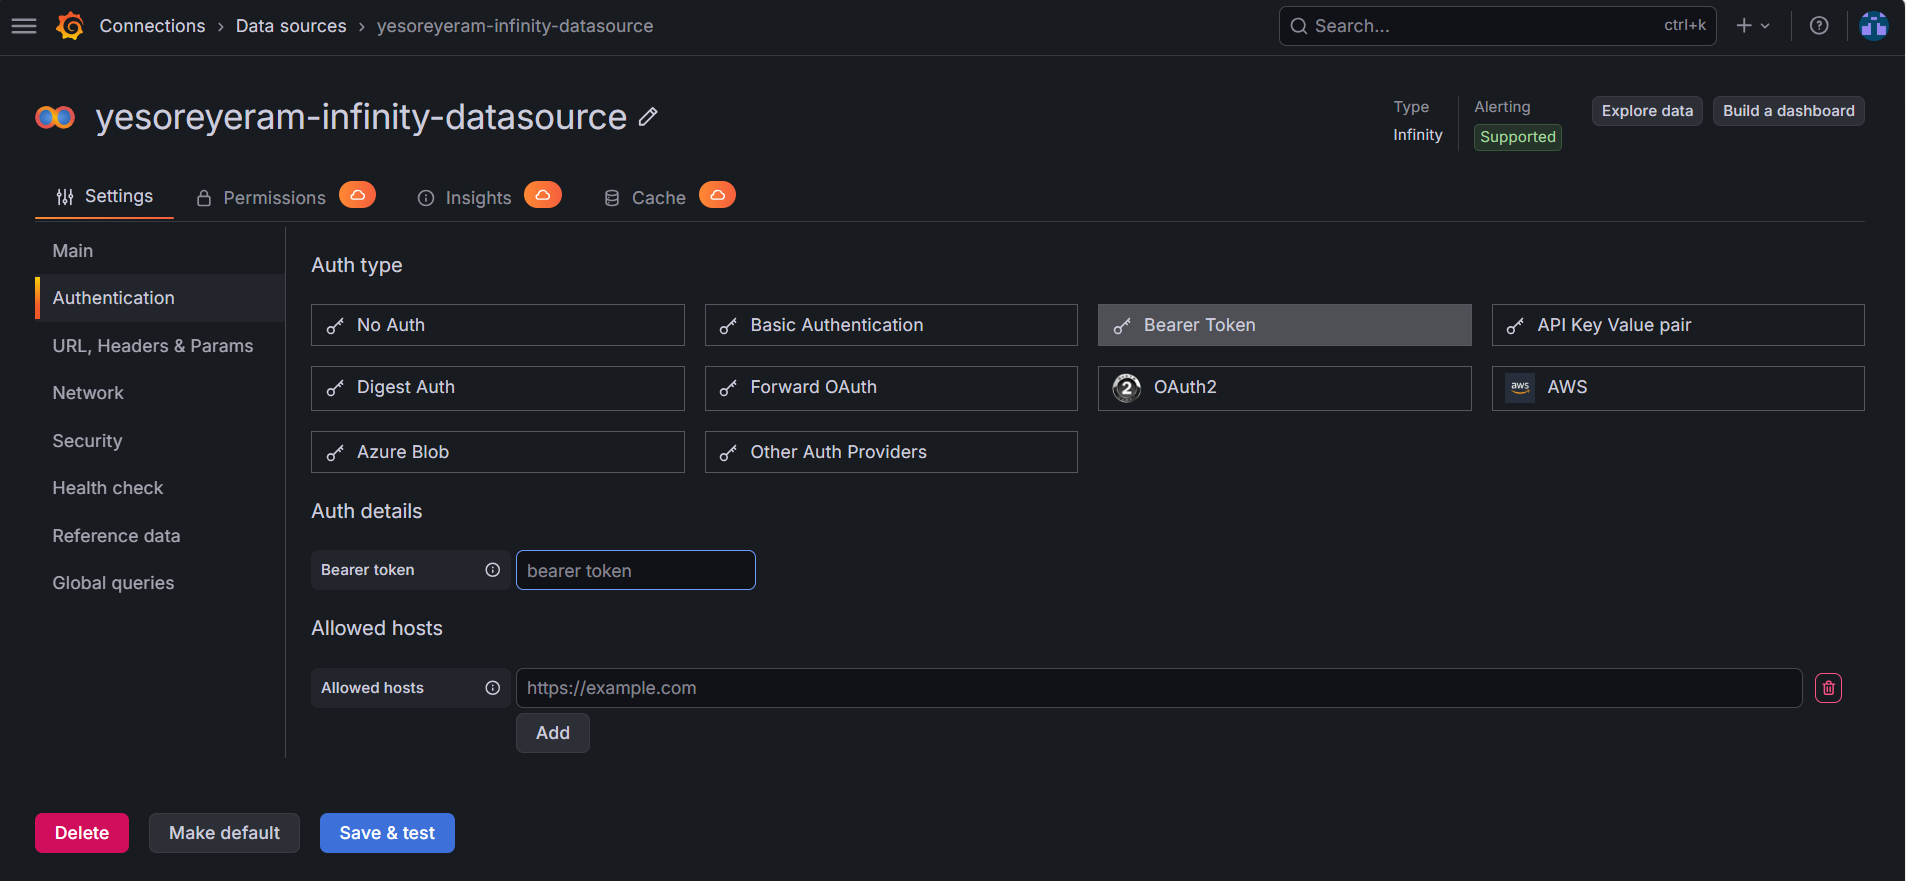
The Infinity datasource supports many data sources and authentication methods, but in this case the usage is simple: the panel only needs to consume inline JSON.
Some online articles or AI tools may suggest configuring authentication directly after installing the plugin. However, the data format returned in this case is a bit special. It needs to be processed first before it is suitable for display in Grafana. Therefore, the GitHub Token is only used inside the cronjob.
Create a Grafana Service Account Token
Next, create a Grafana Service Account Token so the cronjob can call the Grafana API to update the Dashboard.
The path is:
Administration -> General -> Users and Access -> Service Accounts
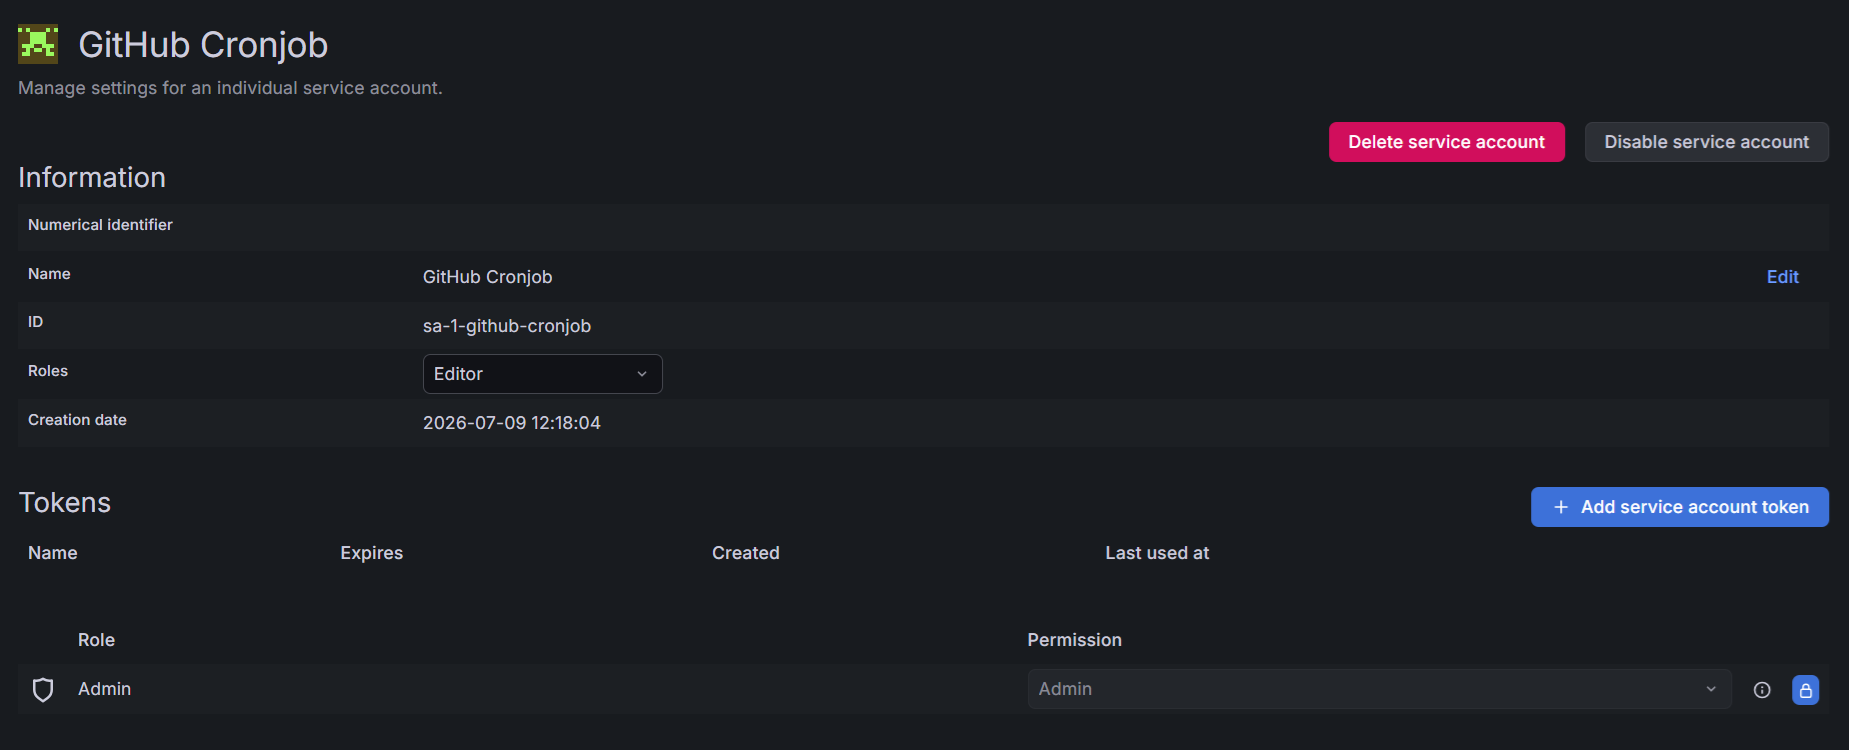
After creating it, store the Token. It will be used later as the GRAFANA_TOKEN environment variable in the cronjob.
Create the Dashboard
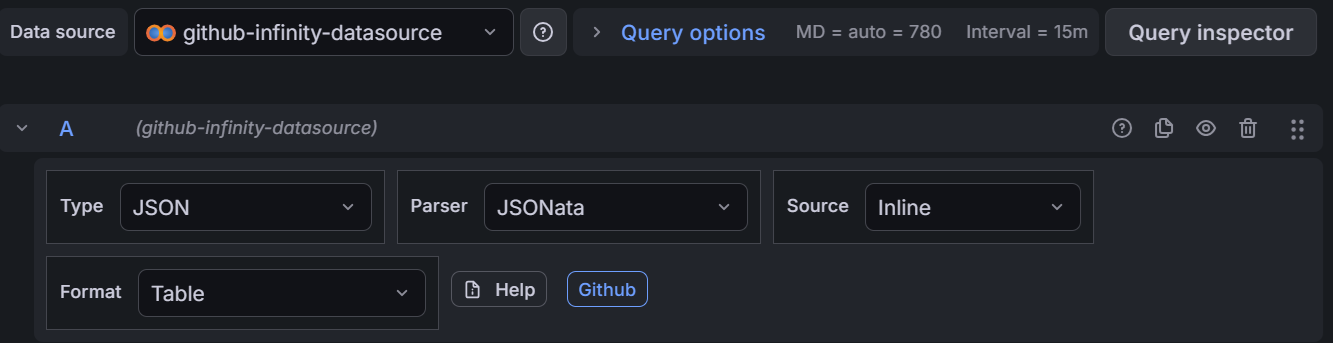
Next, create a Dashboard and add a Panel to it. This Panel will initially use inline JSON from the Infinity datasource as its data source. Later, the cronjob will use the Grafana API to write the latest data back into this panel.
The basic Panel settings are:
- Panel title:
GitHub Copilot Usage Rank - Datasource:
Infinity - Source:
Inline - Format:
JSON - Initial data:
[]is enough to start with
The
Panel titlemust match thePANEL_TITLEused later in the cronjob, because the script uses this title to find the panel that should be updated.
After configuring the data source, expand Parsing options & Result fields in the Infinity query. Here, define the fields that will be used later so Grafana knows which JSON keys to read and how each field should be typed.
At this point, the panel’s inline data may still be just []. The real data will only be written after the cronjob runs, so Grafana may not be able to infer the actual structure while you are creating the panel. If the field types are not defined up front, ai_credits_used may be treated as a string, which can break Group by, SUM, or Sort by later.
The field names here correspond to the JSON keys that the cronjob will write into the inline data. Although the initial data is still [], the metrics JSON downloaded and merged later in this article will contain fields similar to this:
1
2
3
4
5
6
7
[
  {
    "day": "2026-07-09",
    "user_login": "octocat",
    "ai_credits_used": 120
  }
]
For this example, define at least these three fields:
day: the date of the record. Set it toTimeor the date/time type available in your Grafana/Infinity version. This field is useful later if you want to build a daily trend or time-series panel.user_login: the GitHub username. Set it toString; it will be used for grouping.ai_credits_used: the Copilot Credit usage. Set it toNumber; it will be used for summing and sorting.
If you want to show more information in the table later, such as organization, model, or other metrics, you can add those fields here as well. For this article’s usage ranking, day, user_login, and ai_credits_used are enough.
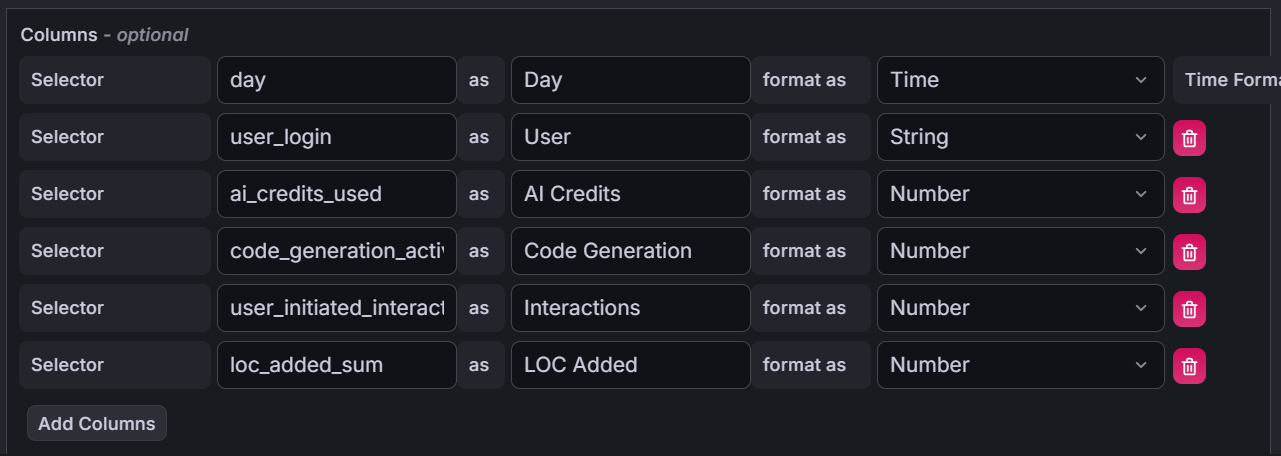
Then switch to Transformations and add the first transformation: Group by.
The Group by settings are:
- Group by field:
user_login - Aggregation field:
ai_credits_used - Aggregation:
SUM
This setting sums ai_credits_used for the same user across rows from different dates, so the Dashboard can show each user’s Copilot Credit usage over the last 28 days. In other words, day remains in the raw data as the time dimension, while this ranking panel aggregates by user before displaying the result.
Then add a second transformation: Sort by.
The Sort by settings are:
- Field:
ai_credits_used - Sort order:
Descending
This puts the users with the highest Credit usage at the top, creating a simple usage ranking.
If you want the ranking table to look cleaner, you can also add Organize fields, keep only the aggregated user_login and ai_credits_used, and rename the fields to something easier to read, such as User and Credits Used. If you later create a daily trend panel, you can use the day field that was preserved in the raw data.
Finally, you can add a Limit transformation to control how many rows are displayed. If your organization has many users, showing only the top 10 keeps the table easier to scan.
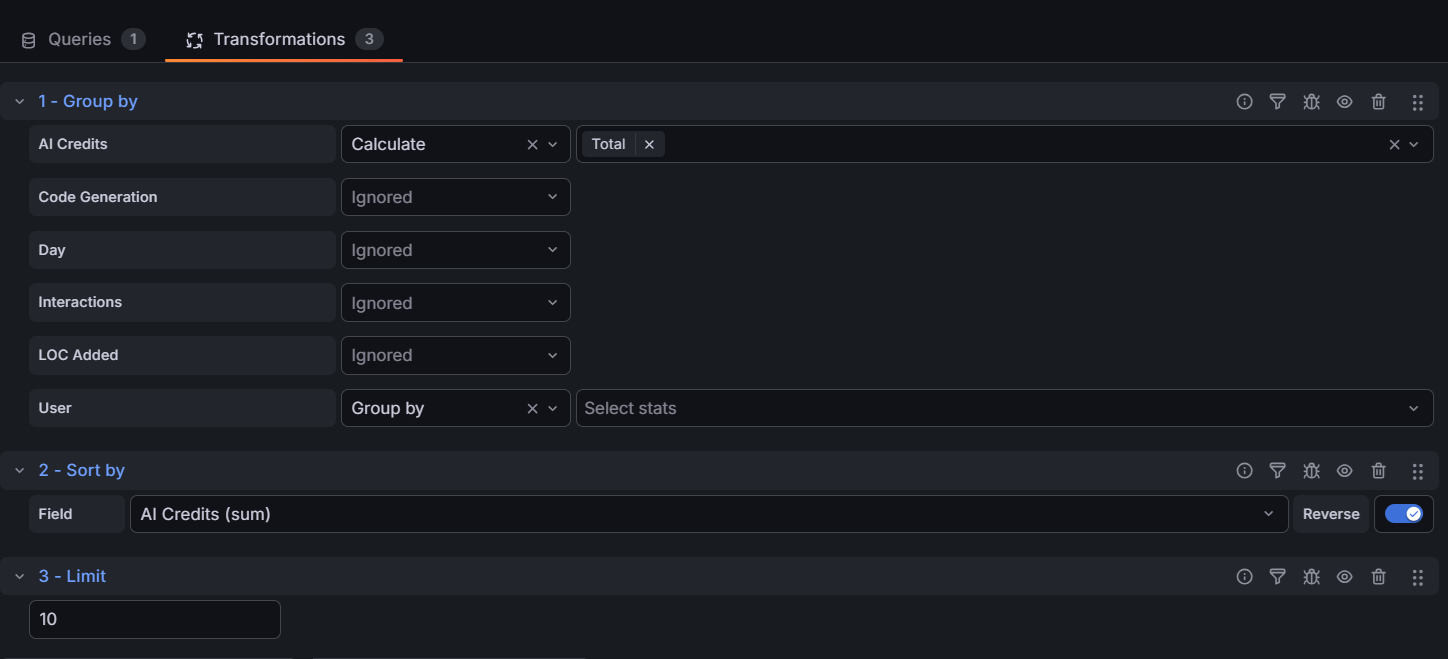
The
Limittransformation only controls how many rows this panel displays. If you need long-term retention or more detailed analysis, it is better to write the data to a database and aggregate it with SQL.
cronjob
Finally, use a scheduled job to update the Dashboard regularly. This script does the following:
- Calls the GitHub API to get the download links for the Copilot metrics report.
- Downloads each report and combines them into a single JSON file with
jq --slurp. - Calls the Grafana API to get the Dashboard JSON.
- Finds the panel whose title is
GitHub Copilot Usage Rank. - Writes the new Copilot metrics JSON into the Infinity inline data of that panel.
- Calls the Grafana API to save the Dashboard.
The reports downloaded from the GitHub API are in
ndjson, also known asJSON Lines. This format is not very convenient to render directly in Grafana, so the cronjob first converts it into JSON that Grafana can handle more easily.
In real usage, store sensitive values such as GITHUB_TOKEN and GRAFANA_TOKEN in Secrets or environment variables. Do not hard-code them directly in the script.
1
2
3
4
5
6
7
8
9
10
11
12
13
14
15
16
17
18
19
20
21
22
23
24
25
26
27
28
29
30
31
32
33
34
35
36
37
38
39
40
41
42
43
44
45
46
47
48
49
50
51
52
53
54
55
56
57
58
59
60
61
62
63
64
65
66
67
68
69
70
71
72
73
set -eu

apk add --no-cache curl jq

GITHUB_TOKEN=""
GITHUB_ORG=""
GRAFANA_TOKEN=""
GRAFANA_HOST=""
DASHBOARD_UID=""
PANEL_TITLE="GitHub Copilot Usage Rank"

# Get the GitHub Copilot metrics download links and merge the data into one JSON file.
curl --fail-with-body --silent --show-error \
  -H "Accept: application/vnd.github+json" \
  -H "X-GitHub-Api-Version: 2022-11-28" \
  -H "Authorization: Bearer ${GITHUB_TOKEN}" \
  "https://api.github.com/orgs/${GITHUB_ORG}/copilot/metrics/reports/users-28-day/latest" |
jq -r ".download_links[]" |
while IFS= read -r url; do
  curl --fail --silent --show-error --location "${url}"
done |
jq --slurp "." > /tmp/copilot-metrics.json

cat /tmp/copilot-metrics.json

# Get the Grafana Dashboard configuration.
echo
echo "Dashboard UID: ${DASHBOARD_UID}"

curl --fail-with-body --silent --show-error \
  -H "Authorization: Bearer ${GRAFANA_TOKEN}" \
  "${GRAFANA_HOST}/api/dashboards/uid/${DASHBOARD_UID}" \
  > /tmp/dashboard.json

PANEL_COUNT=$(
  jq --arg title "${PANEL_TITLE}" \
    '[.dashboard.panels[] | select(.title == $title)] | length' \
    /tmp/dashboard.json
)

if [ "${PANEL_COUNT}" -eq 0 ]; then
  echo "ERROR: Cannot find panel '${PANEL_TITLE}' in dashboard ${DASHBOARD_UID}"
  exit 1
fi

# Check the original data stored in the Infinity panel.
echo
echo "===== Original Infinity Data ====="

jq -r --arg title "${PANEL_TITLE}" \
  '.dashboard.panels[] | select(.title == $title) | .targets[0].data' \
  /tmp/dashboard.json

# Write the new metrics JSON back to the target panel.
jq --rawfile newData /tmp/copilot-metrics.json --arg title "${PANEL_TITLE}" '
  (.dashboard.panels[] | select(.title == $title) | .targets[0].data) = $newData
' /tmp/dashboard.json > /tmp/dashboard-updated.json

# Update the Grafana Dashboard.
jq '{
  dashboard: .dashboard,
  overwrite: true,
  message: "Updated GitHub Copilot metrics data"
}' /tmp/dashboard-updated.json |
curl --fail-with-body --silent --show-error \
  -X POST \
  -H "Authorization: Bearer ${GRAFANA_TOKEN}" \
  -H "Content-Type: application/json" \
  --data-binary @- \
  "${GRAFANA_HOST}/api/dashboards/db"

echo
echo "Dashboard updated successfully."
After the cronjob runs successfully, the inline data that was originally set to [] will be replaced with the new metrics JSON, and Grafana will render the ranking according to the transformations configured earlier.
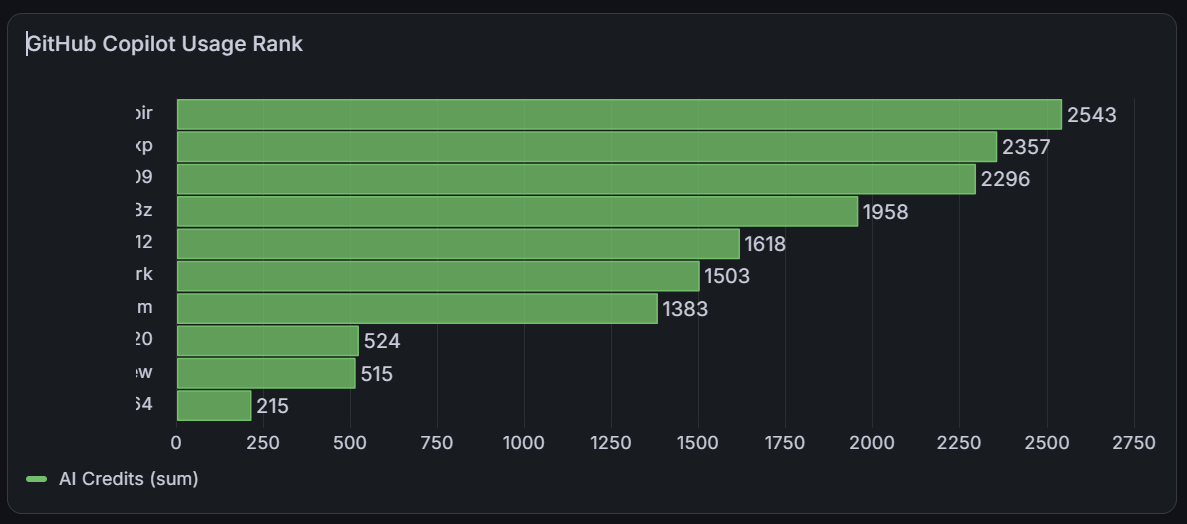
The screenshot masks the account names because exposing real user accounts is not appropriate for this example.
This example uses the API for the last 28 days and renders the result in Grafana. GitHub Copilot Credit usage resets on the first day of each month, so building a true per-user cumulative usage chart requires more custom logic in the cronjob. I may cover that in a separate article.
Summary
The key idea is to extract GitHub Copilot Credit usage from the GitHub management interface and convert it into data that Grafana can display and track. The GitHub API provides the raw usage data, the cronjob regularly processes it, and Grafana handles visualization and future alerting.
The more complete architecture is to call the API, store the data in a database, and let Grafana query from there. That makes it easier to reshape the data with SQL and is a better fit for long-term retention. If you do not want to maintain a database yet, processing the JSON and updating the panel directly is a simple enough starting point.
If your team already uses Grafana for monitoring, this approach lets Copilot usage enter the same monitoring workflow, without requiring everyone who wants to view usage data to access the GitHub admin interface.