How to Enable Amazon S3 Request Metrics: Monitor Requests, Errors, and Latency with CloudWatch
Learn the difference between Amazon S3 Storage Metrics and Request Metrics, and enable request metrics using the AWS Console, AWS CLI, Terraform, or CloudFormation.

Amazon S3 is one of the oldest and most widely used services on AWS. In addition to storing files, it is commonly used for backups, static website assets, data lakes, and application uploads.
After creating a bucket, you can find capacity metrics such as BucketSizeBytes and NumberOfObjects on the Metrics page. However, capacity data alone cannot answer questions such as:
- How many
GETorPUTrequests occurred each minute? - Are users encountering more
4xxor5xxerrors? - Is S3 response time increasing?
- Which prefix receives the most traffic?
To answer these questions, you need to enable Amazon S3 Request Metrics. This article first explains the different types of S3 metrics, then shows how to enable Request Metrics with the AWS Management Console, AWS CLI, Terraform, and CloudFormation.
What CloudWatch Metrics Does S3 Provide?
The metrics that S3 sends to CloudWatch can be divided into the following categories:
| Type | Update frequency | Enabled by default | Common use |
|---|---|---|---|
| Storage Metrics | Once per day | Yes, at no additional charge | View bucket size and object count |
| Request Metrics | Every minute | No; requires a metrics configuration | Monitor request volume, errors, traffic, and latency |
| Replication Metrics | Every minute | Must be enabled on the replication rule | Monitor replication latency, pending data, and failed operations |
| S3 Storage Lens | Daily aggregation with optional advanced metrics | Free and paid tiers are available | Analyze storage and activity across accounts, Regions, or an organization |
S3 is therefore not limited to two metrics. It only enables the daily Storage Metrics by default. To obtain near-real-time request information, you must create a Request Metrics configuration.
Request Metrics are charged at standard CloudWatch rates and delivered on a best-effort basis. They are useful for trends, dashboards, and alarms, but should not be treated as a complete per-request audit trail or exact billing record. Use S3 Server Access Logging or CloudTrail Data Events when complete records are required.
What Data Becomes Available?
Request Metrics send data to the AWS/S3 namespace in CloudWatch. Common metrics include:
AllRequests: the total number of HTTP requests.GetRequests,PutRequests, andDeleteRequests: request counts by operation type.ListRequests: requests that list bucket contents.BytesDownloadedandBytesUploaded: the number of bytes downloaded and uploaded.4xxErrorsand5xxErrors: client-side and server-side errors.FirstByteLatency: the time from receiving a request until S3 starts returning the first byte.TotalRequestLatency: the time from receiving a request until the response is complete.
Each metrics configuration enables the full set of Request Metrics; you cannot enable only one metric. Metrics for operations that have not occurred might not appear in CloudWatch yet.
Monitor an Entire Bucket or Filter Specific Objects
When creating a configuration, you can monitor the entire bucket or narrow the scope with the following criteria:
- An object key prefix, such as
uploads/orlogs/production/. - An object tag, such as
environment=production. - An S3 Access Point ARN.
- A combination of multiple conditions; an object must match all of them.
If several systems share a bucket, consider creating separate configurations by application or prefix, such as production-uploads and audit-logs. The FilterId dimension in CloudWatch can then distinguish the workloads and avoid collecting unnecessary data.
There is one important caveat: when a filter is configured, only single-object operations that match the filter are counted. Requests such as ListObjects and DeleteObjects, which cannot be associated with one object, do not appear in a filtered configuration. To monitor the bucket’s complete request volume, create an additional configuration without a filter.
Method 1: AWS Management Console
The console is the most straightforward way to enable Request Metrics:
- Open the Amazon S3 console and select the target general purpose bucket.
- Choose the Metrics tab.
- Under Bucket metrics, choose View additional charts.
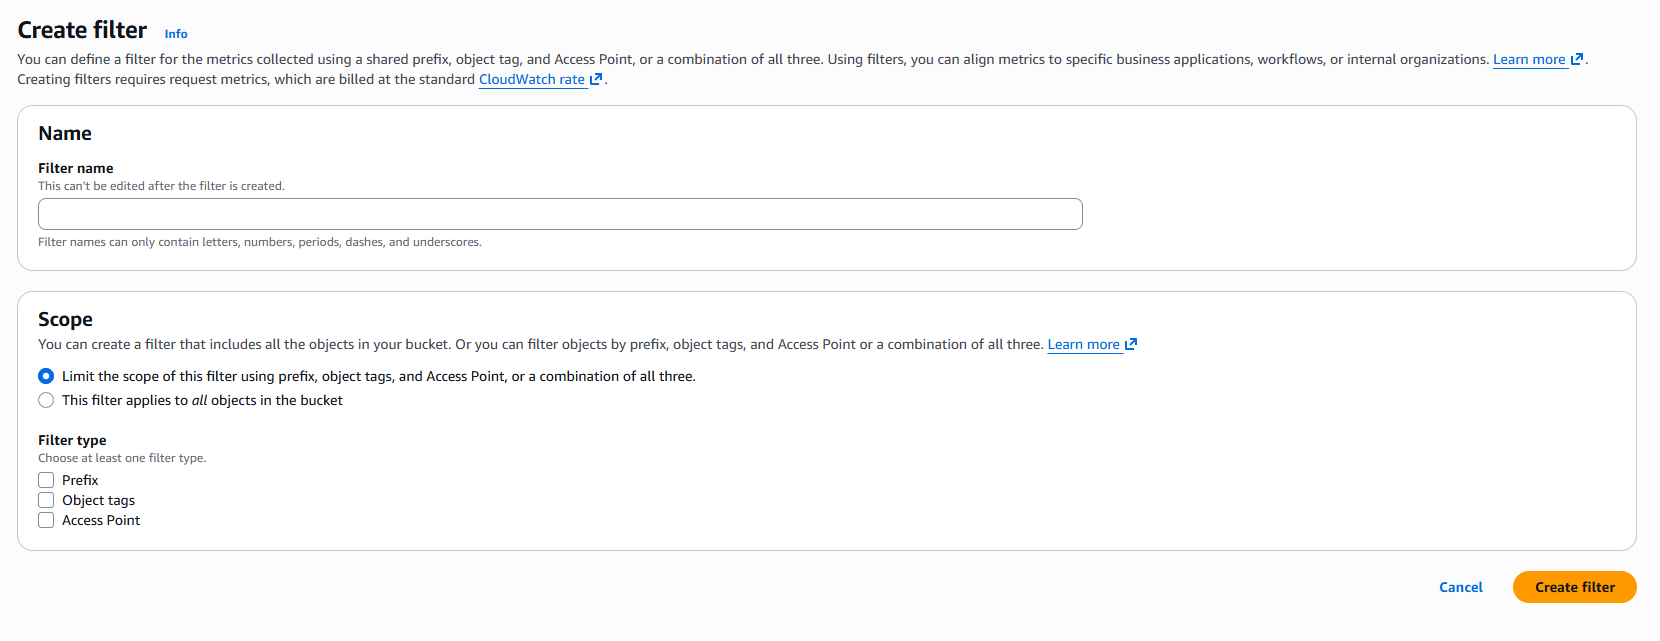
- Open Request metrics, then choose Create filter.
- Enter a filter name, such as
EntireBucket. - To monitor the entire bucket, do not add a filter. To monitor only some objects, add a prefix, object tags, or an S3 Access Point.
- Save the configuration.
Charts do not appear immediately. According to the AWS documentation, data becomes visible roughly 15 minutes after CloudWatch starts tracking the metrics. If the bucket receives no requests, the corresponding metrics are not generated.
Method 2: AWS CLI
The AWS CLI makes it possible to include this operation in scripts or CI/CD. The following command enables Request Metrics for the entire bucket:
1
2
3
4
aws s3api put-bucket-metrics-configuration \
  --bucket example-bucket \
  --id EntireBucket \
  --metrics-configuration '{"Id":"EntireBucket"}'
To monitor only the uploads/ prefix, add a Filter:
1
2
3
4
aws s3api put-bucket-metrics-configuration \
  --bucket example-bucket \
  --id Uploads \
  --metrics-configuration '{"Id":"Uploads","Filter":{"Prefix":"uploads/"}}'
List the current configurations after running the command:
1
2
aws s3api list-bucket-metrics-configurations \
  --bucket example-bucket
To remove a configuration, run:
1
2
3
aws s3api delete-bucket-metrics-configuration \
  --bucket example-bucket \
  --id Uploads
The IAM principal needs s3:PutMetricsConfiguration to create, update, or delete configurations. Reading and listing configurations requires s3:GetMetricsConfiguration.
Method 3: Terraform
If Terraform already manages the bucket, use Terraform for Request Metrics as well so that the configuration remains under version control.
Monitor the Entire Bucket
1
2
3
4
5
6
7
8
resource "aws_s3_bucket" "example" {
  bucket = "example-bucket"
}

resource "aws_s3_bucket_metric" "entire_bucket" {
  bucket = aws_s3_bucket.example.id
  name   = "EntireBucket"
}
The name of aws_s3_bucket_metric becomes the metrics configuration ID, which appears as the FilterId in CloudWatch.
Filter by Prefix and Object Tag
1
2
3
4
5
6
7
8
9
10
11
12
resource "aws_s3_bucket_metric" "production_uploads" {
  bucket = aws_s3_bucket.example.id
  name   = "ProductionUploads"

  filter {
    prefix = "uploads/"

    tags = {
      environment = "production"
    }
  }
}
Review the expected changes before creating the resource:
1
2
terraform plan
terraform apply
If the bucket already exists but is not managed by the same Terraform configuration, specify the bucket name directly. You do not need to recreate the bucket just to enable metrics:
1
2
3
4
resource "aws_s3_bucket_metric" "entire_bucket" {
  bucket = "existing-example-bucket"
  name   = "EntireBucket"
}
Method 4: AWS CloudFormation
In CloudFormation, declare the configurations in MetricsConfigurations on an AWS::S3::Bucket resource:
1
2
3
4
5
6
7
8
9
Resources:
  ExampleBucket:
    Type: AWS::S3::Bucket
    Properties:
      BucketName: example-bucket
      MetricsConfigurations:
        - Id: EntireBucket
        - Id: Uploads
          Prefix: uploads/
Use TagFilters to add an object tag filter:
1
2
3
4
5
6
MetricsConfigurations:
  - Id: ProductionUploads
    Prefix: uploads/
    TagFilters:
      - Key: environment
        Value: production
CloudFormation fully replaces a metrics configuration during an update. Keep every configuration that is still required in the template; omitted entries are removed.
Finding the Metrics in CloudWatch
After Request Metrics start producing data, find them as follows:
- Open the Amazon CloudWatch console.
- Go to Metrics → All metrics.
- Choose S3.
- Choose Request metrics, or search by
BucketNameandFilterId.
CloudWatch must be set to the Region that contains the bucket. If no metrics appear, check the following:
- The metrics configuration was created successfully.
- The AWS account and Region are correct.
- The bucket has actually received requests since metrics were enabled.
- The prefix or tag filter matches the objects being accessed.
- Approximately 15 minutes have passed.
For a quick test, perform several PUT and GET operations on a test object, then inspect AllRequests, PutRequests, and GetRequests. Common alarm strategies include monitoring 5xxErrors and FirstByteLatency, or using Metric Math to calculate 4xxErrors / AllRequests.
Cost and Usage Recommendations
Request Metrics are billed as CloudWatch metrics. Each additional configuration can produce a full set of metrics, so avoid creating a filter for every small prefix or enabling Request Metrics across a large number of buckets without evaluating the cost.
Start with important production buckets and create configurations only for workloads that genuinely need alarms or troubleshooting:
- To understand the overall health of a bucket, create an unfiltered
EntireBucketconfiguration. - When several applications share a bucket, group them by prefix or Access Point.
- When only specific data matters, combine a prefix with an object tag.
- For a per-request audit trail, use CloudTrail Data Events or S3 Server Access Logging.
- For long-term analysis across buckets, accounts, or an organization, evaluate S3 Storage Lens.
A single bucket supports up to 1,000 metrics configurations, but reaching the quota should not be the goal. More configurations also make dashboards, alarms, and cost management more complicated.
Conclusion
The default S3 Storage Metrics are useful for monitoring capacity, but they do not show application request volume, errors, or latency in near real time. With Request Metrics enabled, CloudWatch can display GET, PUT, 4xx, 5xx, transfer volume, and latency at one-minute intervals, making it possible to build dashboards and alarms.
Use the AWS Console for testing or one-off setup, the AWS CLI for automation, and Terraform or CloudFormation to keep production configuration under version control. Finally, remember that Request Metrics are not free and are delivered on a best-effort basis. They are an operational monitoring tool, not a complete access audit log.